The trading journal
built to help you trade better.
Log every trade, review every day, and uncover the patterns that separate losing habits from winning ones.
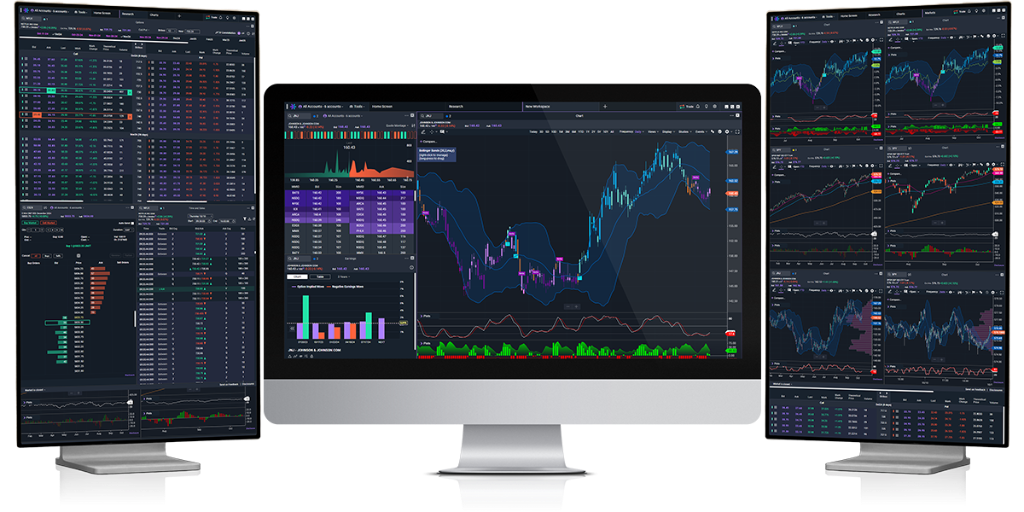
20+
Performance Metrics
1,000,000,000
Trades Tracked
100%
Private by Default
0
Manual Calculations
See your trading performance come to life
TradeFlow Journal turns raw broker data into a visual trading dashboard with real-time P&L analytics, equity curves, win-rate gauges, profit factor tracking, and a color-coded trading calendar — everything futures traders need to identify edges and eliminate costly mistakes.
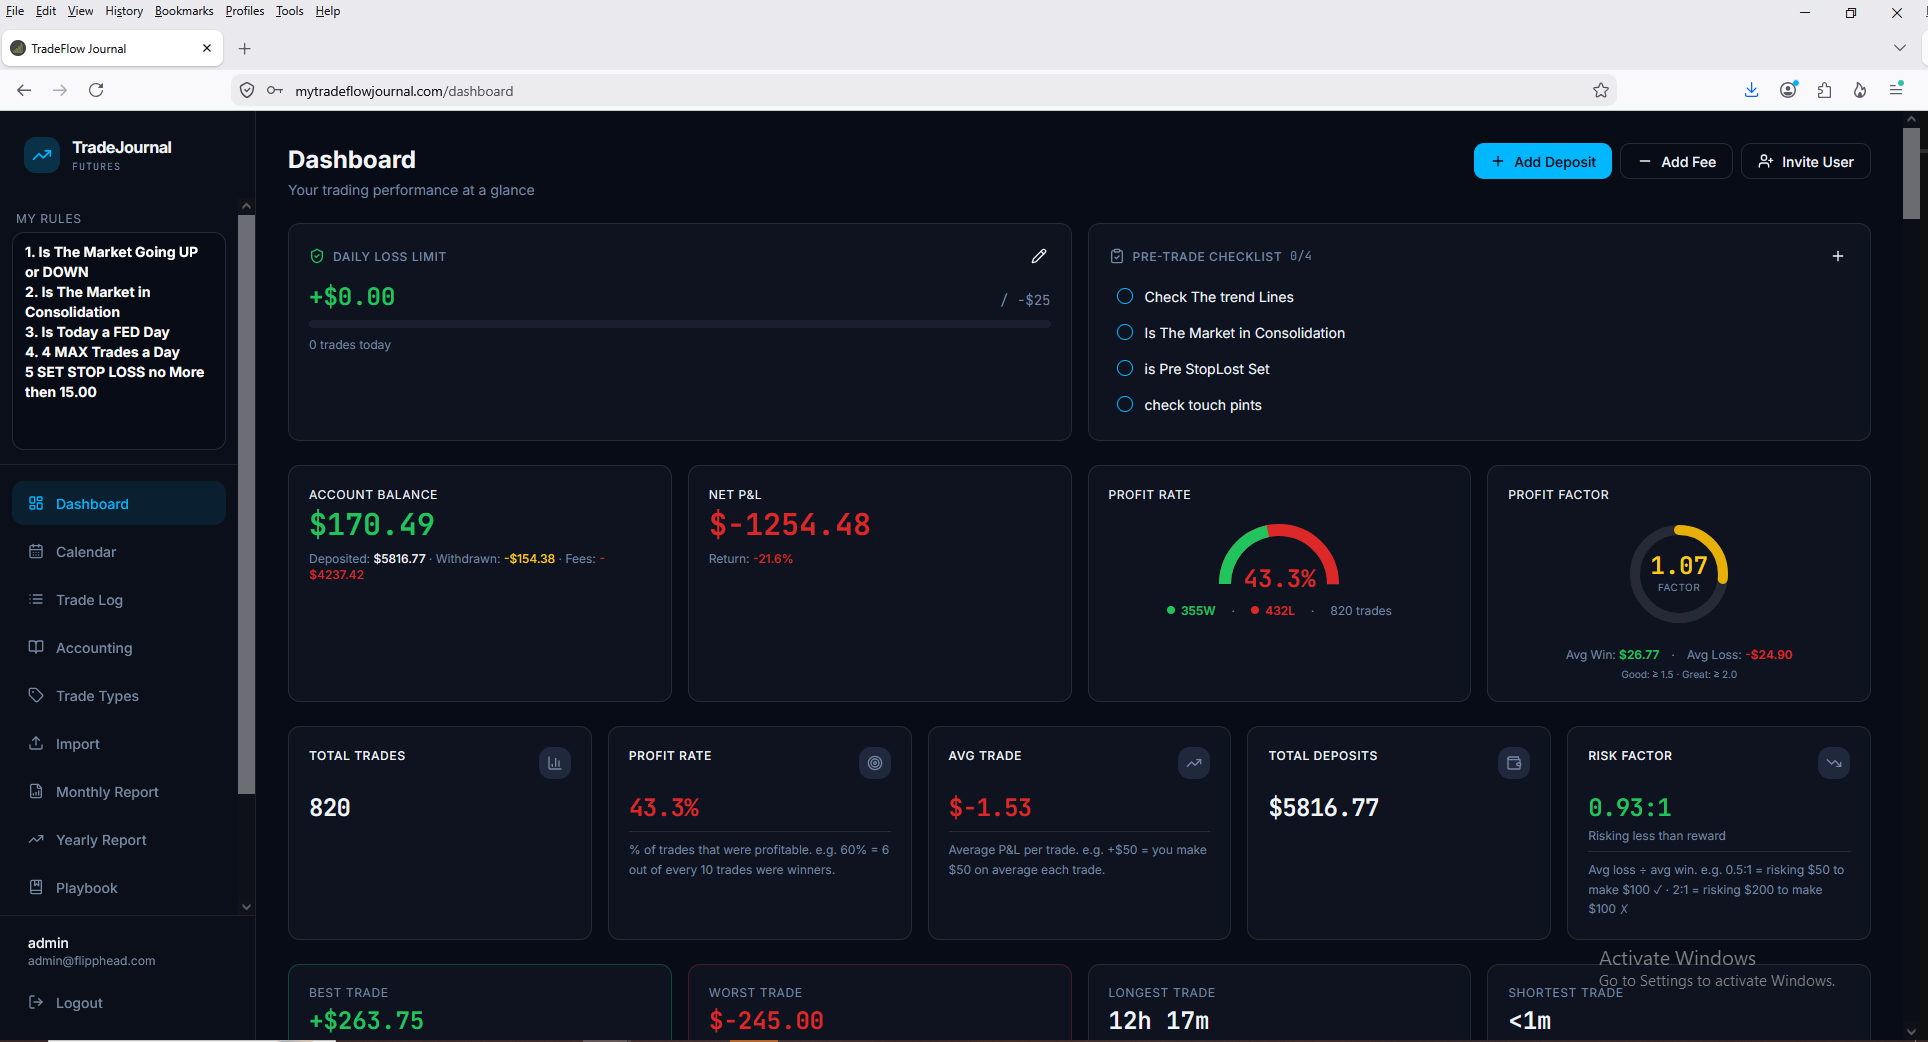
Comprehensive Trading Dashboard
Get an instant snapshot of your futures trading performance. The dashboard displays your account balance, net P&L, return percentage, win rate, profit factor, and risk factor — all calculated automatically from your imported trades. Track total deposits, average trade P&L, best and worst trades, and longest and shortest hold times at a glance.
- ▸ Real-time account balance with deposits, withdrawals, and fee tracking
- ▸ Win rate and profit factor gauges for quick performance assessment
- ▸ Daily loss limit tracker to enforce risk management discipline
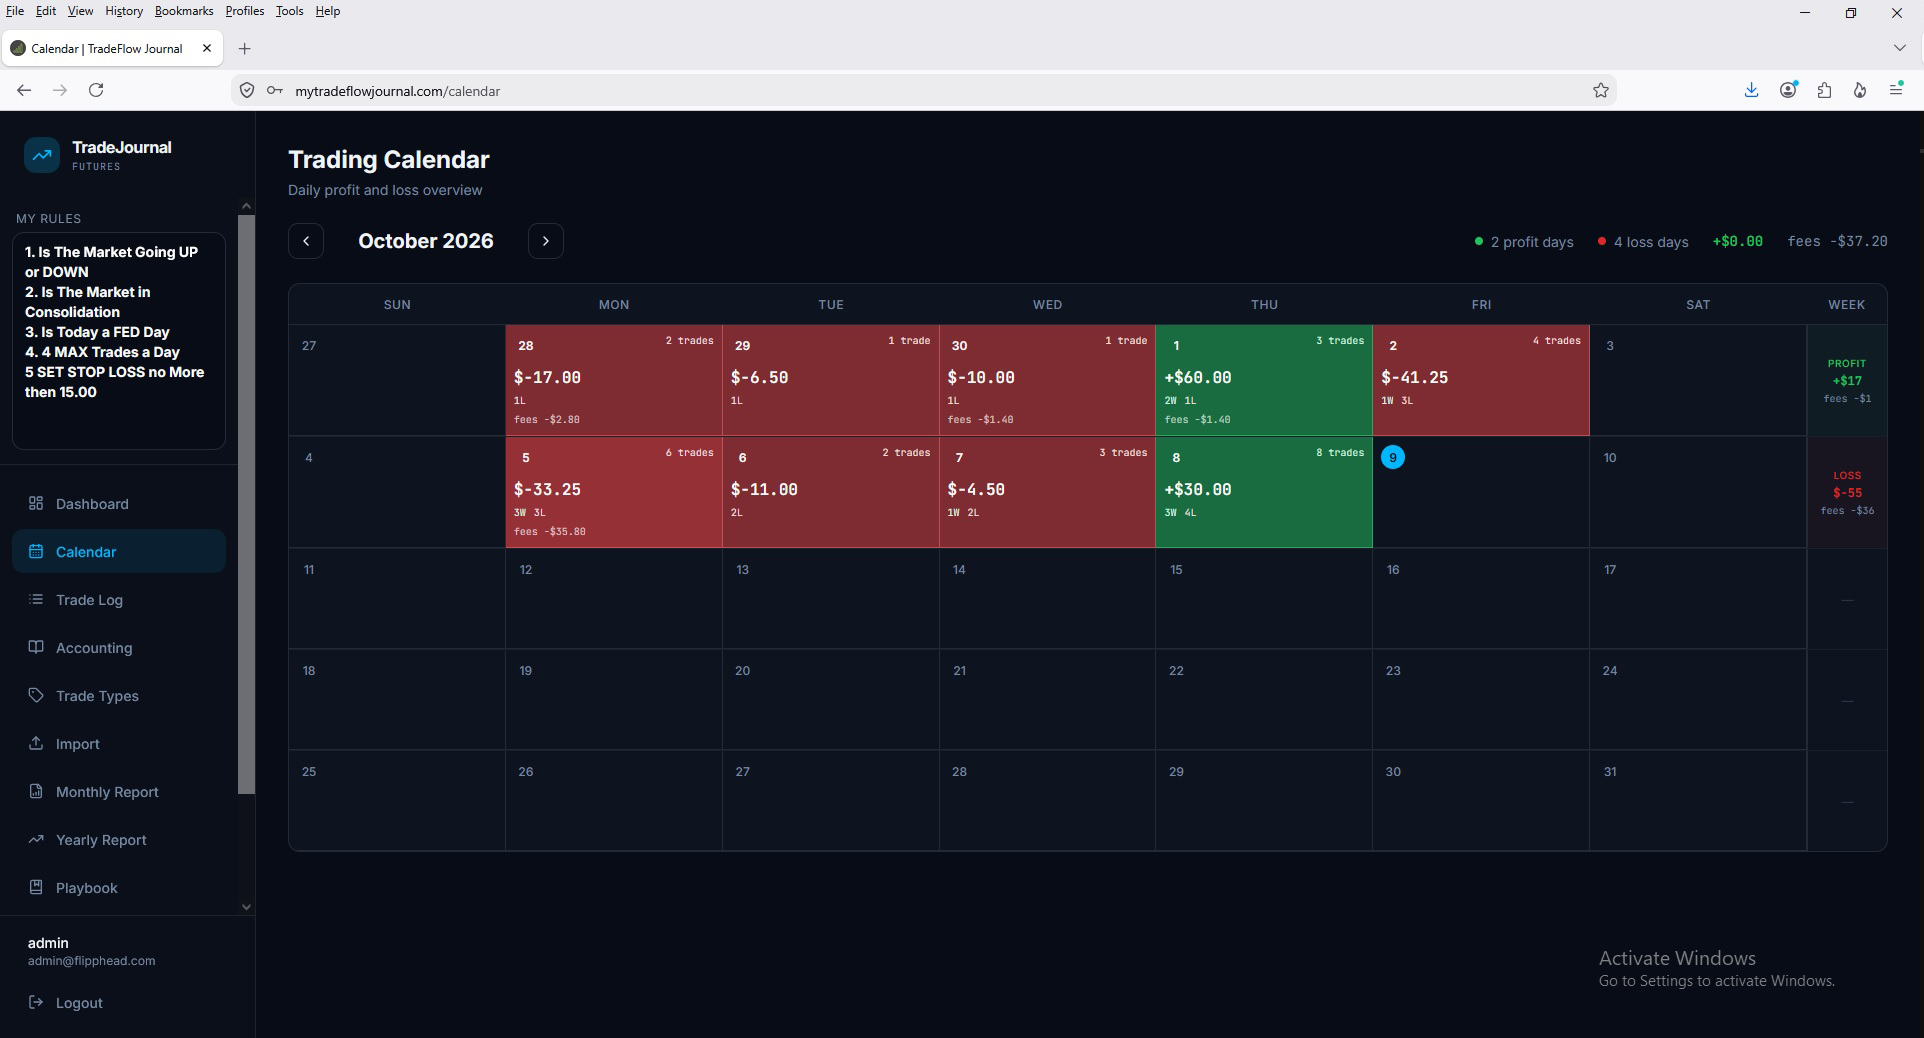
Color-Coded Trading Calendar
Visualize every trading day in a calendar heatmap. Green days, red days, and neutral days reveal your trading patterns at a glance. Click any day to drill into hourly P&L breakdowns, individual trade details, entry and exit screenshots, and a performance radar chart that scores your discipline across eight key metrics.
- ▸ Monthly P&L heatmap with daily profit and loss color coding
- ▸ Day-detail view with hourly P&L breakdown and trade-by-trade analysis
- ▸ Performance radar chart scoring eight dimensions of trading discipline
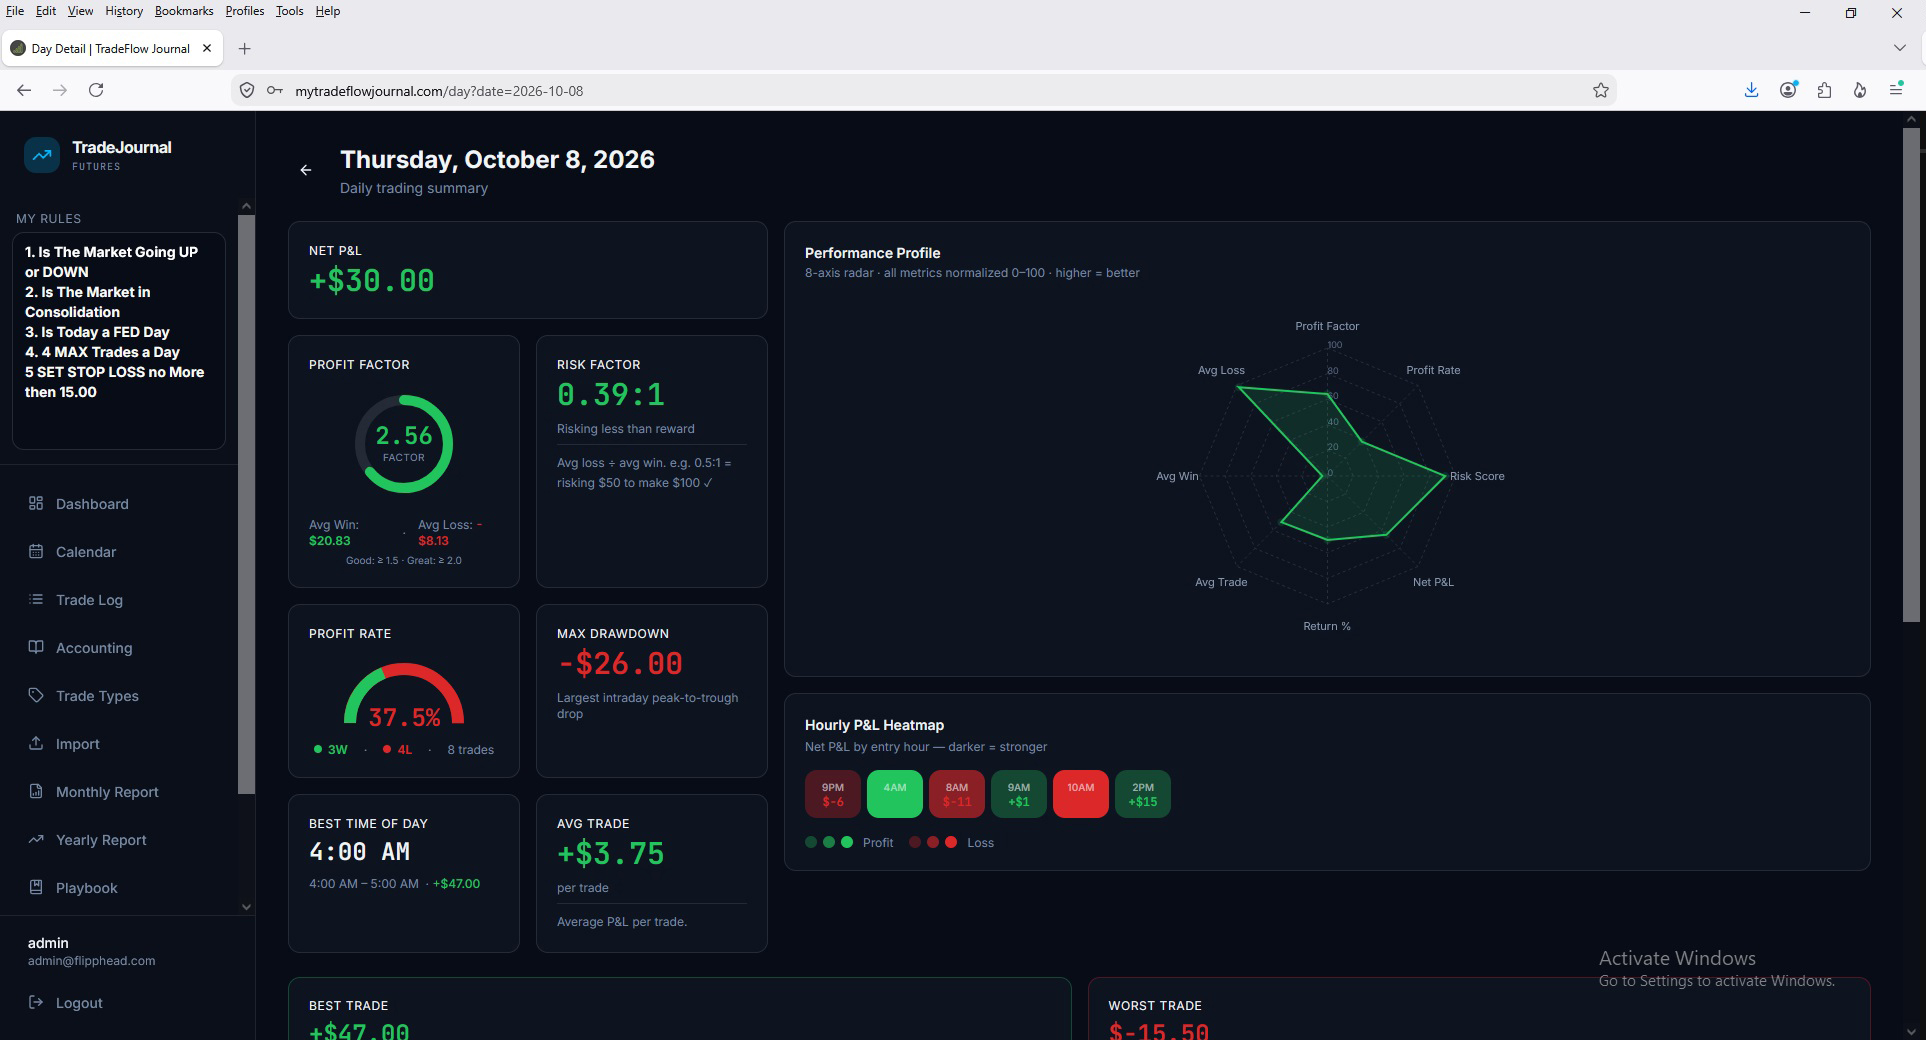
Day-by-Day Performance Reviews
Drill into any trading day for a complete performance breakdown. Each day detail view shows net P&L, profit factor, risk factor, profit rate, max drawdown, best time of day, and average trade — all calculated automatically. An eight-axis performance radar chart scores your discipline across every dimension, and an hourly P&L heatmap reveals which hours of the day you trade best.
- ▸ Eight-axis performance radar chart scoring your trading discipline
- ▸ Hourly P&L heatmap showing your most and least profitable hours
- ▸ Full daily metrics with profit factor, risk factor, and max drawdown
Everything a serious trader needs
Stop guessing. Start reviewing with data-driven tools designed specifically for futures traders.
Performance Analytics
Profit factor, win rate, drawdown, R-multiples and more — all calculated automatically.
Trading Calendar
See every trading day at a glance with color-coded P&L heatmaps by month.
Detailed Day Reviews
Drill into any day for hourly P&L breakdowns, radar performance profiles and trade-by-trade analysis.
Equity Curve
Track your account growth over time with cumulative P&L charting.
Private & Secure
Your trades are yours only. Full row-level security keeps your data completely private.
Instant Import
Paste your broker export and trades are imported in seconds — no manual entry needed.
The complete futures trading journal for serious traders
TradeFlow Journal is a professional-grade trading journal built specifically for futures traders who want to track, analyze, and improve their trading performance. Whether you trade the E-mini S&P 500 (ES), Micro E-mini (MES), E-mini Nasdaq (NQ), Micro Nasdaq (MNQ), Gold (GC), Micro Gold (MGC), Crude Oil (CL), Micro Crude Oil (MCL), Dow Jones (YM), or Russell 2000 (RTY), our platform automatically calculates your P&L using the correct point values for every contract.
Stop relying on spreadsheets and manual calculations. Import your trades directly from your broker — including TradingView, Optimus Futures, and other major futures brokers — and let TradeFlow Journal handle the math. Our import engine matches buy and sell orders into complete trades, calculates profit and loss with proper point values, assigns the correct trading session date, and eliminates duplicate entries automatically.
Track key performance metrics including win rate, profit factor, average win, average loss, risk factor, R-multiples, expectancy, maximum drawdown, and return on capital. Visualize your performance with cumulative P&L charts, daily P&L bar charts, equity curves, and an eight-dimensional performance radar chart. Use the trading calendar to spot patterns in your daily results, and drill into any day for an hour-by-hour breakdown of your trading activity.
Enforce discipline with a daily loss limit tracker and a customizable pre-trade checklist. Build a playbook of your favorite trading setups — opening drives, bull flags, breakouts, reversals, scalps — and tag each trade to see which strategies consistently generate profits. Attach chart screenshots with AI-powered entry and exit point detection, and review your execution against your plan.
Your data stays private and secure with row-level security — only you can see your trades, deposits, fees, and withdrawals. No other user has access to your trading data. Export your full trade history and accounting ledger to CSV anytime for tax reporting, performance review, or sharing with your trading coach.
Ready to level up?
Start journaling your trades today and discover what's holding back your performance.